
Technical Analysis is as an art which helps traders to judge where the market is moving. There are various tools for technical analysis such as indicators, moving averages, fibonacci lines, Gann Square and many more.
Financial markets doesn't move in a straight line, there's a pattern, and this pattern is formed with respect to various factors. The most common factors are Supply and Demand, asset or stock popularity, past history, volume, volatility and so on. All these factors repeat over a certain period of time which is called a market cycle.
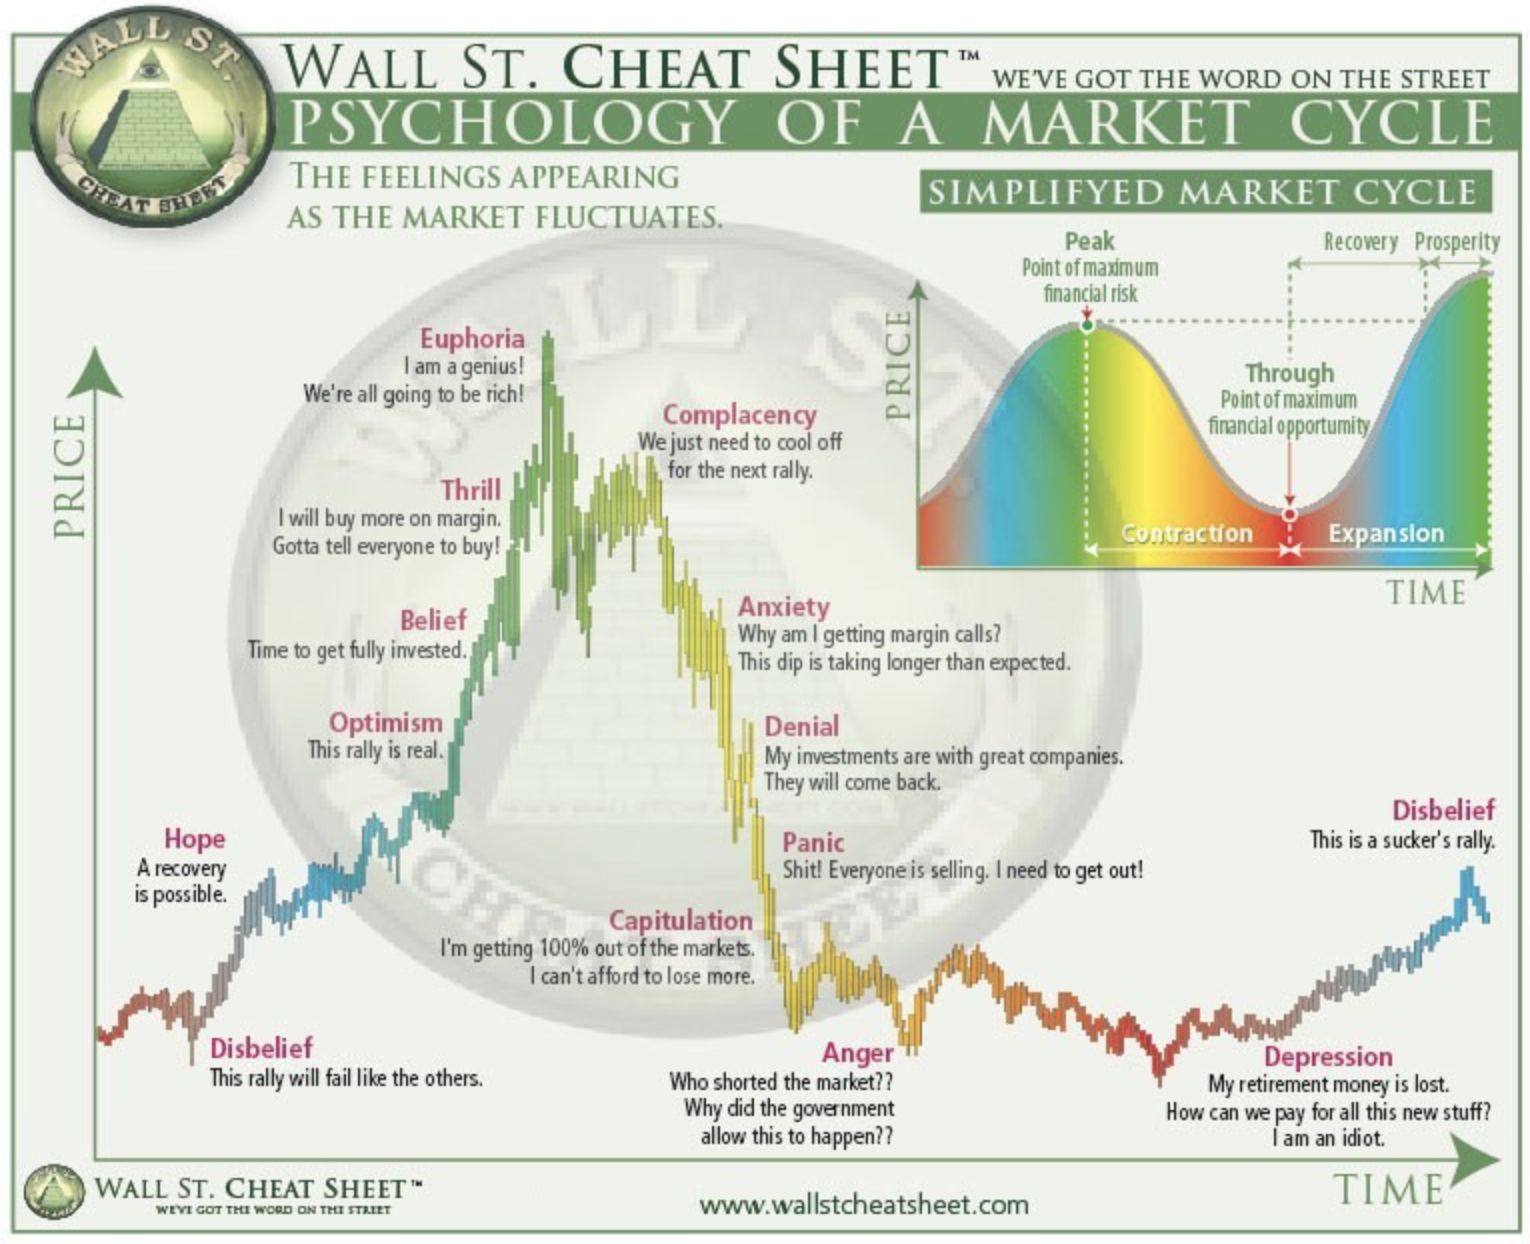
All financial markets moves like this from time to time. Now, to know exactly at what stage the market is right now is gauged using this art of technical analysis.
Prerequisites for technical analysis
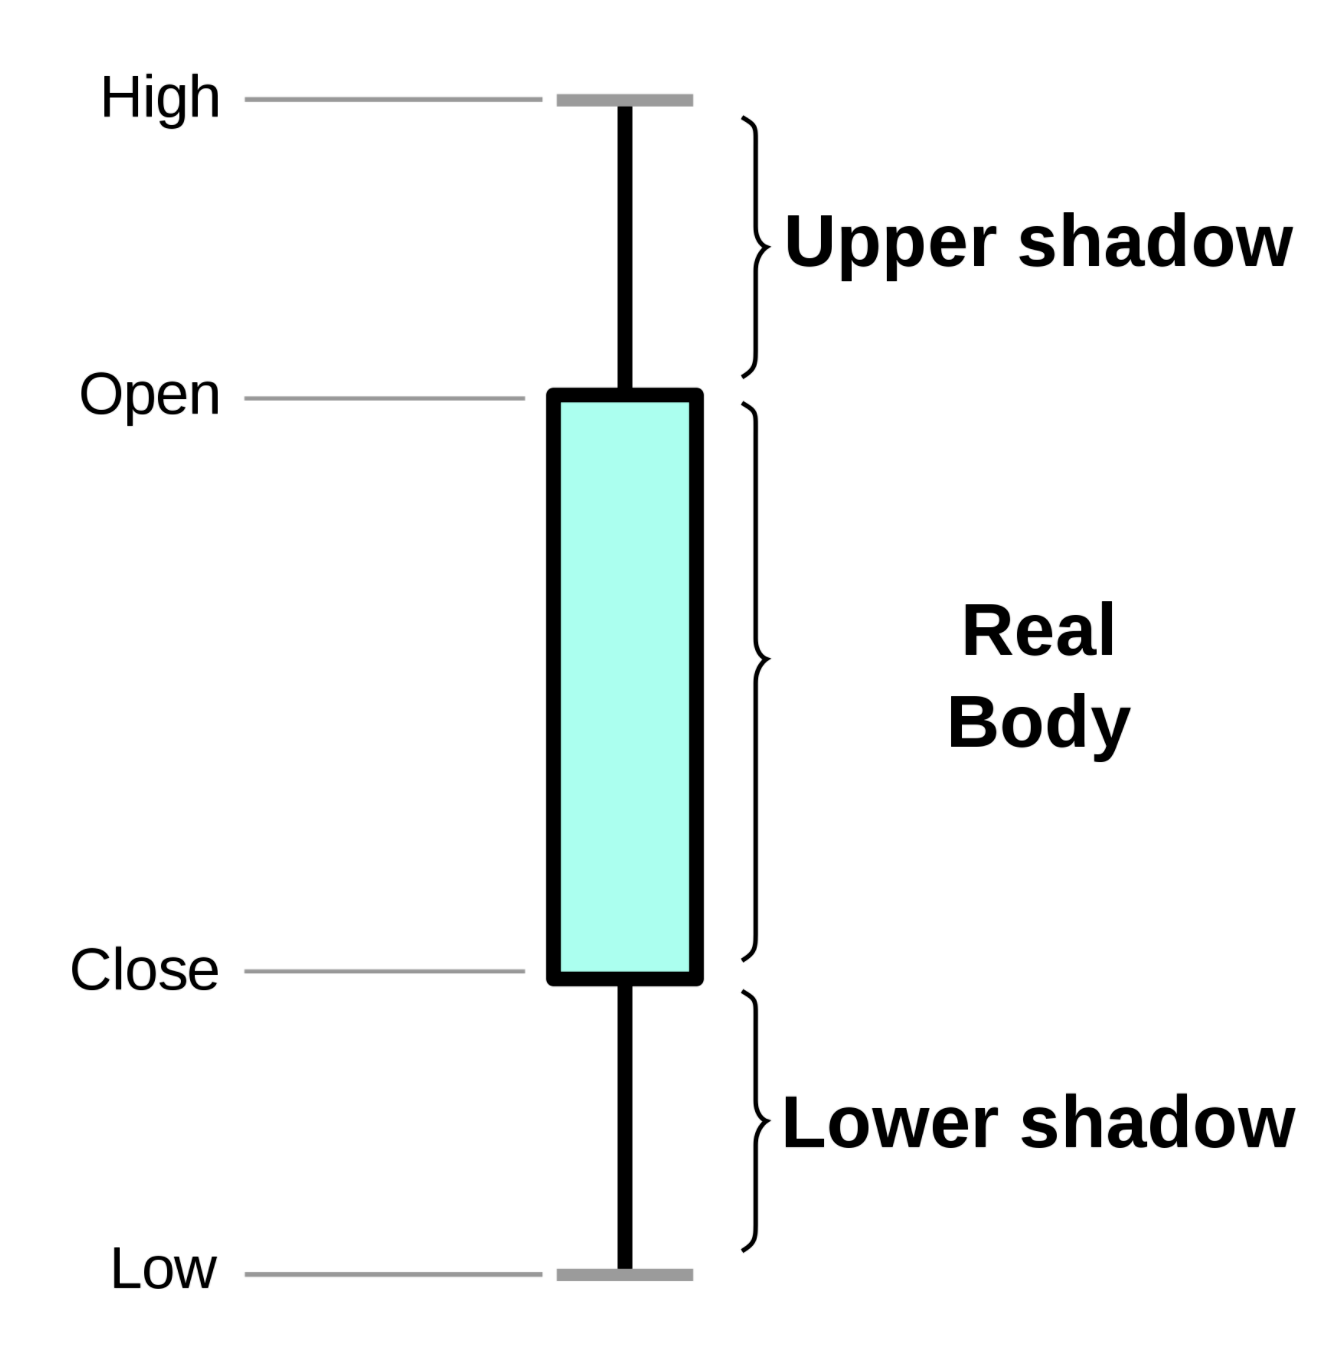
Technical analysis is done over charts and these charts are made using candles. These candles are price candles which consists of data like open, high, low and close price.
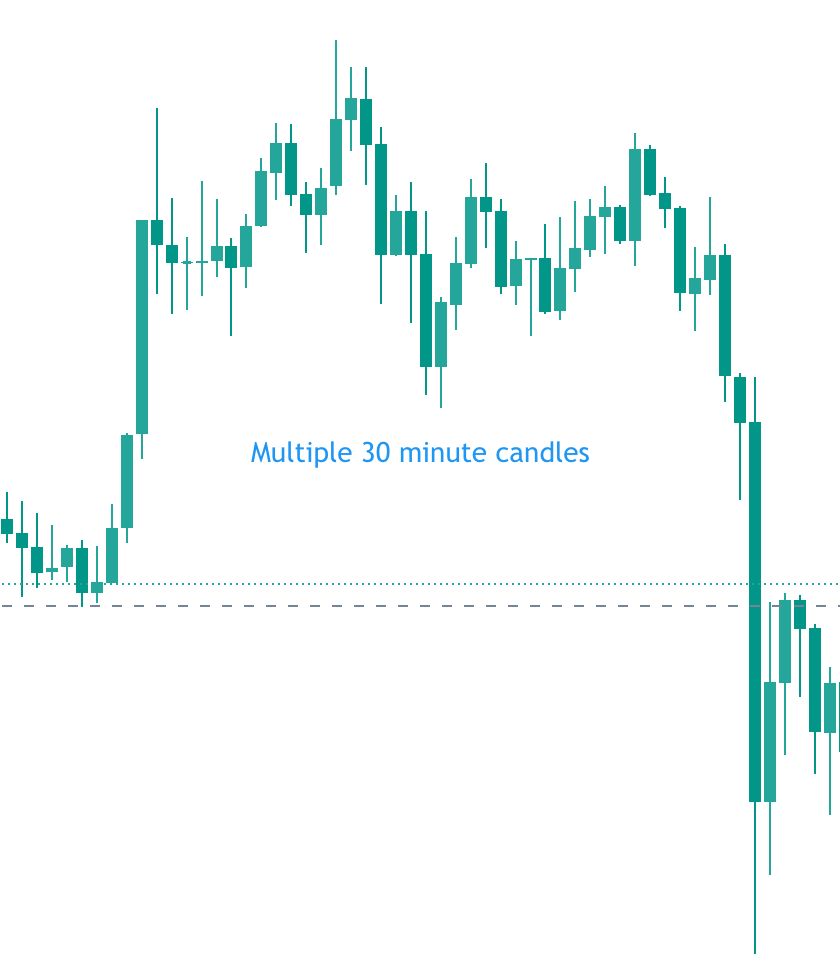
These charts can be customised to include technical indicators, moving averages, support and resistance lines, fibonacci and many more tools available on the TradingView website.
Popular Indicators
Most popular indicators used by traders are RSI, MACD, Bollinger Bands, CCI, VWAP and moving averages. When these indicators are applied on a chart it gives the trader a glimpse of where a market is going to move, based on which the trader makes a buy/sell or long/short decision. One needs to learn how these indicators are used to make those informed decisions.
Also, markets are manipulative to a great extent and when that does happen, only using indicators for trading decisions isn't enough. We would need more insights, knowledge and experience to gauge these kind of market movements. Volume profiles does help during those moments.
Trend Lines
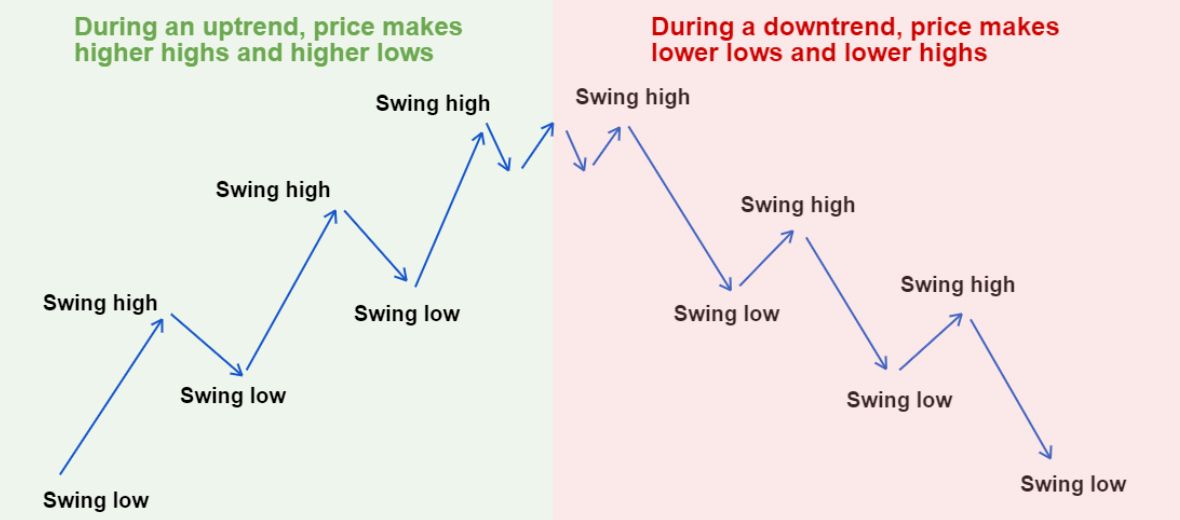
In trading, we have a saying "Trend is your friend, don't trade against the trend my friend" which hold true most of the times. Market is either bullish i.e trending upwards, bearish i.e trending downwards or sideways i.e accumulation zone. Traders create trend lines in combination with indicators to make sure where the market is moving. Generally when the market makes higher highs and higher lows, it is in an uptrend, whereas when the market makes lower highs and lower lows, its in a downtrend.
Volume and Price action
Volume and price action are the two primary components for any financial markets, be it crypto, stocks, commodities or anything which is trade-able. Volume represents the amount of asset brought or sold in a particular period, for eg. if 100k bitcoin are bought and sold within 1 hour, that's 1 hour volume. Price action is how much the price has moved in a particular period, for eg, it can move 1%, 2% or 3% within 15 minutes, 30 minutes or an hour. Traders combine these two metrics, which helps them to make an informed decision for buying/selling or holding.
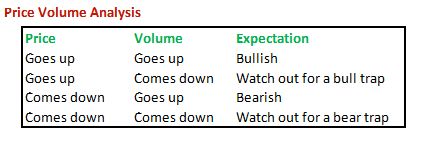
So, it's not always that if price and volume both comes down, it's bearish, rather it could be a bear trap and traders generally wait for one or two candles for the confirmation to open any short positions. Same happens for the opposite, while opening a long position.
Technical analysis is a skill which is learnt over time, and more you practise charting and get involved in these concepts, more you learn.
To learn more in depth technical analysis concepts you can follow below links :
 Corporate Finance Institute
:max_bytes(150000):strip_icc()/portfolio-51e706b4670940199cb802ba95b25a1f.jpg)
Subscribe to Plezna
Crypto knowledge delivered, right to your inbox