Introduction
MACD stands for Moving Average Convergence Divergence which is invented in 1979 by Gerald Appel, is one of the most popular technical indicators in trading. The MACD is appreciated by traders all over the world over for its simplicity and flexibility, as it can be used either as a trend or momentum indicator.
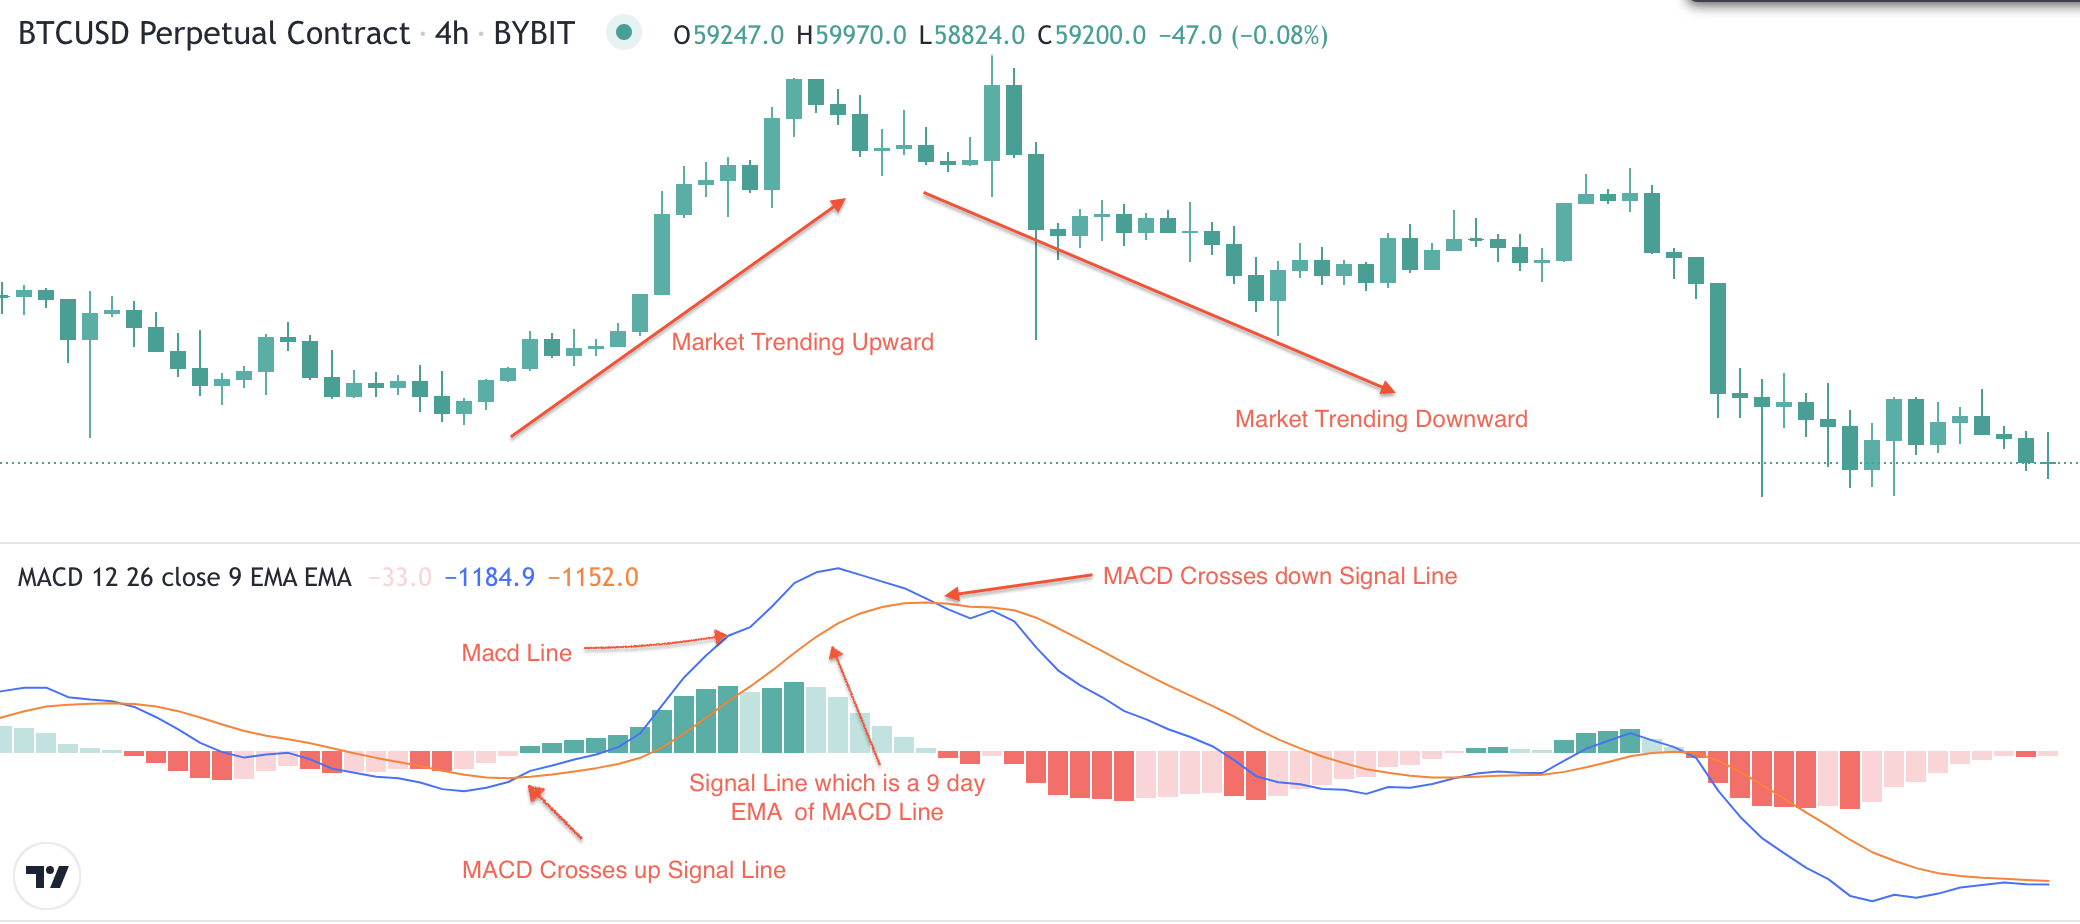
It is a trend following indicator that shows a relationship between two moving averages. It is calculated by subtracting the 26-period exponential moving average from the 12-period exponential moving average(ema). The resulting line is the MACD line. This is the 9-day ema of the MACD which is called the "Signal Line" which can be used as a trigger to generate buy and sell signals.
Components of MACD Indicator
MACD is basically comprised of
- 12-Day EMA
- 26-Day EMA
- MACD Line which is calculated by subtracting the 26-period exponential moving average (EMA) from the 12-period EMA
- A Signal Line which is a nine-day EMA of the MACD and is plotted on top of the MACD line
- A Histogram which graphs the distance between the MACD and its signal line.
How to trade using MACD Indicator?
Traders consider it as a Buy signal when MACD line crosses above the signal line and a SELL signal when it crosses below the signal line. If the MACD is above the signal line, the histogram will be above the MACD’s baseline. If the MACD is below its signal line, the histogram will be below the MACD’s baseline. Traders use the MACD’s histogram to identify when bullish or bearish momentum is high.

Pros
- MACD can be used as a trend indicator as well as a momentum indicator.
- MACD mostly provides clear buy and sell signals using the MACD crossovers and divergences.
- MACD can be used in combination with other technical indicators for more clarity.
Cons
- It can sometimes provide false reversals. Reversal signals shown by the MACD divergence does not mean a significant reversal would happen. It could mean there might be a temporary pause or sideways move in the market. Therefore, MACD cannot forecast all reversals.
- MACD does not often give an accurate analysis of a trend multiple times.


Subscribe to Plezna
Crypto knowledge delivered, right to your inbox